
Kubernetes gives you a lot of data. But not all of it is actually useful for understanding what is happening inside your cluster. That is where kube-state-metrics architecture becomes important.
If you have ever wondered how Kubernetes object data turns into something useful, you are not alone. How does it become something you can query? And how does it turn into alerts or dashboards? This is the missing piece. Not just what kube-state-metrics does, but how it fits into the bigger system.
In this guide, you will see the architecture clearly:
- how kube-state-metrics interacts with Kubernetes
- how data flows through the system
- where Prometheus fits in
- and how everything connects in a real-world setup
If you already understand the basics, this will give you the mental model you actually need to use it properly.
What Is Kube State Metrics (Quick Context)
Before we get into architecture, let us keep the idea simple. Kube-state-metrics is a small service that reads data from Kubernetes objects and turns it into metrics you can actually use. It does not track CPU or memory. Instead, it shows you the state of your cluster.
For example, it helps you see things like:
- how many replicas you want vs how many are running
- whether pods are healthy or failing
- the condition of your deployments
- if your nodes are ready or not
In short, it tells you what is happening inside Kubernetes, not how much resource it is using. Now let us move to what most guides skip, the architecture behind it.
Kube State Metrics Architecture (Simple View)
At a high level, the architecture is simple and easy to follow. There are only a few components, and each one has a clear role. Here is the full flow:
Kubernetes API → Kube-State-Metrics → HTTP Endpoint → Prometheus → Visualization (Grafana)
This flow shows how data moves from your cluster to your dashboards. Let us learn it in detail.
Understanding Kube-State-Metrics Architecture (Step-by-Step Flow)
Step 1: Watching the Kubernetes API
Kube-state-metrics connects directly to the Kubernetes API server. It does not scrape logs. It does not inspect containers. Instead, it watches Kubernetes resources like pods, deployments, nodes, services and statefulsets. This is important because it means:
- the data is always consistent with Kubernetes state
- there is no guesswork or sampling
- updates happen in near real-time
Step 2: Converting Objects Into Metrics
Raw Kubernetes objects are not directly usable in monitoring systems. Kube-state-metrics transforms them into Prometheus-compatible metrics. For example:
Instead of “Deployment has 3 desired replicas and 2 available”, you get:
kube_deployment_spec_replicaskube_deployment_status_replicas_available
This transformation is what makes querying possible. It creates structured, labeled metrics that tools like Prometheus understand.
Step 3: Exposing Metrics via HTTP Endpoint
Once the data is converted, kube-state-metrics exposes everything through a simple HTTP endpoint. Typically:
/metricsThis endpoint:
- contains all exported metrics
- updates automatically as cluster state changes
- does not store historical data
It is just a live view of the current Kubernetes state.
Step 4: Prometheus Scrapes the Data
Kube-state-metrics does not push data anywhere. Instead, Prometheus pulls (scrapes) it at regular intervals. This is a key design decision. Prometheus:
- collects the metrics
- stores them over time
- enables queries using PromQL
Without Prometheus, kube-state-metrics is just a data source.
Step 5: Visualization and Alerting
Once Prometheus has the data, you can:
- build dashboards (Grafana)
- create alerts
- run queries
This is where raw metrics turn into actionable insights.
Kube State Metrics Data Flow (Clear Breakdown)
Let us connect everything into a clean mental model.
Data Flow Overview
- Kubernetes updates object state
- kube-state-metrics watches and reads that state
- it converts the state into metrics
- metrics are exposed via HTTP
- Prometheus scrapes and stores them
- dashboards and alerts use that data
This flow is important because it tells you something critical, kube-state-metrics is not a monitoring tool. It is a data translator in the pipeline
Where Kube State Metrics Fits in Kubernetes Architecture
Kubernetes monitoring is not a single tool. It is a system made of multiple layers that work together.
Kube-state-metrics sits in the middle of that system. It connects raw Kubernetes data with your monitoring stack. But the real value is not just where it sits. It is what kind of visibility it adds.
It Adds Context, Not Just Data
Most tools show numbers. Kube-state-metrics show the meaning behind those numbers. For example:
- CPU looks fine → but pods are crashing
- memory is stable → but replicas are not available
Without state data, you only see part of the picture. With it, you understand what is actually wrong.
It Works Alongside Other Tools
Kube-state-metrics is not meant to replace anything. It works together with:
- Metrics Server → for CPU and memory
- Prometheus → for storing and querying data
- Grafana → for dashboards and alerts
Each tool solves a different problem. Kube-state-metrics fills the gap between cluster state and observability.
It Helps You Ask Better Questions
Good monitoring is not about having more data. It is about asking the right questions. With kube-state-metrics, you can ask:
- Are my deployments healthy?
- Are replicas matching the desired state?
- Which pods are failing and why?
Without it, these questions are harder to answer.
It Makes Debugging Faster
When something breaks, time matters. Kube-state-metrics helps you:
- quickly spot mismatches
- understand cluster behavior
- narrow down the root cause
You are not guessing. You are reading the actual state of the system.
Why This Layered Approach Still Matters
Even though the flow looks simple, the separation is powerful. Each layer focuses on one job:
- Kubernetes → holds the truth
- kube-state-metrics → explains the state
- Prometheus → remembers it over time
- Grafana → makes it visible
Because of this, you can scale each part independently, can swap tools if needed and debug issues without confusion. That is what makes the architecture reliable in real-world setups.
Kube State Metrics Kubernetes Integration
Integration is usually done through Kubernetes-native deployment. Most setups use Helm charts and YAML manifests. Once deployed:
- kube-state-metrics runs inside the cluster
- it connects automatically to the API server
- Prometheus is configured to scrape its endpoint
There is no complex wiring required. But small configuration decisions matter:
- which resources to expose
- how many labels to include
- scrape interval
These directly impact performance and usability.
Key Components Inside the Architecture
Let us simplify the internal pieces.
API Watchers
These stay connected to the Kubernetes API. They watch for changes in resources. When something changes, they catch it quickly. This keeps the data fresh and up to date.
Metric Generators
These turn Kubernetes data into metrics. Raw data is complex. They convert it into simple, structured metrics with labels. Each resource type has its own mapping. This makes the data easy to query.
Exporter Endpoint
This is where metrics are exposed. It is usually a simple /metrics endpoint. Prometheus collects data from here. It does not store anything. It just shows the current state.
What This Architecture Does Well
This architecture is simple, but it solves real problems in Kubernetes monitoring.
1. Gives You Meaningful Visibility
Most monitoring tools show numbers. This setup shows what those numbers actually mean. You can see:
- whether deployments are healthy
- if replicas match the desired state
- which resources are failing
This makes your data easier to understand.
2. Keeps Data Accurate and Up to Date
Kube-state-metrics reads directly from the Kubernetes API. It reflects the current state of your cluster. You are not guessing based on sampled data. You are seeing what Kubernetes actually knows.
3. Works Smoothly With the Monitoring Stack
This architecture fits naturally into tools you already use.
- Prometheus collects and stores data
- Grafana helps you visualize it
There is no need for complex integration. Everything connects in a clean, predictable way.
What It Does Not Do (Common Misunderstanding)
This is where many setups go wrong. Kube-state-metrics does NOT:
- show CPU or memory usage
- monitor application performance
- replace metrics server
It only exposes state data. If you need resource usage, you still need metrics server or other performance monitoring tools. Understanding this difference helps you avoid confusion and bad setup decisions.
When This Architecture Becomes Useful
This setup starts to matter when your cluster grows or things stop working as expected.
1. When Something Looks Fine but Still Fails
Sometimes the CPU and memory look normal. But your application is not working. This architecture helps you see:
- missing replicas
- failing pods
- unhealthy deployments
You stop guessing and start seeing the real issue.
2. When Alerts Need More Context
Basic alerts only tell you that something is wrong. With state metrics, alerts can show:
- what failed
- where it failed
- what condition caused it
This makes alerts easier to act on.
3. When Dashboards Feel Incomplete
Dashboards with only resource metrics feel limited. You also need:
- deployment health
- pod status
- cluster conditions
This is where kube-state-metrics adds real value.
4. When Your Setup Starts Scaling
As your cluster grows, complexity increases. You need a clear structure:
- how data is collected
- how it flows
- how it is used
This architecture gives you that clarity and control.
Common Mistakes to Avoid
1. Treating It Like a Monitoring Tool
Kube-state-metrics is not a full monitoring solution. It only exposes data. It does not create alerts. It does not analyze anything on its own. You still need tools like Prometheus and Grafana. They turn this data into alerts and dashboards.
2. Ignoring Data Flow
If you do not understand how data moves, things break easily. You may configure Prometheus incorrectly. You may miss the correct endpoint. As a result:
- data does not get collected
- dashboards show incomplete information
A simple understanding of the flow saves a lot of time.
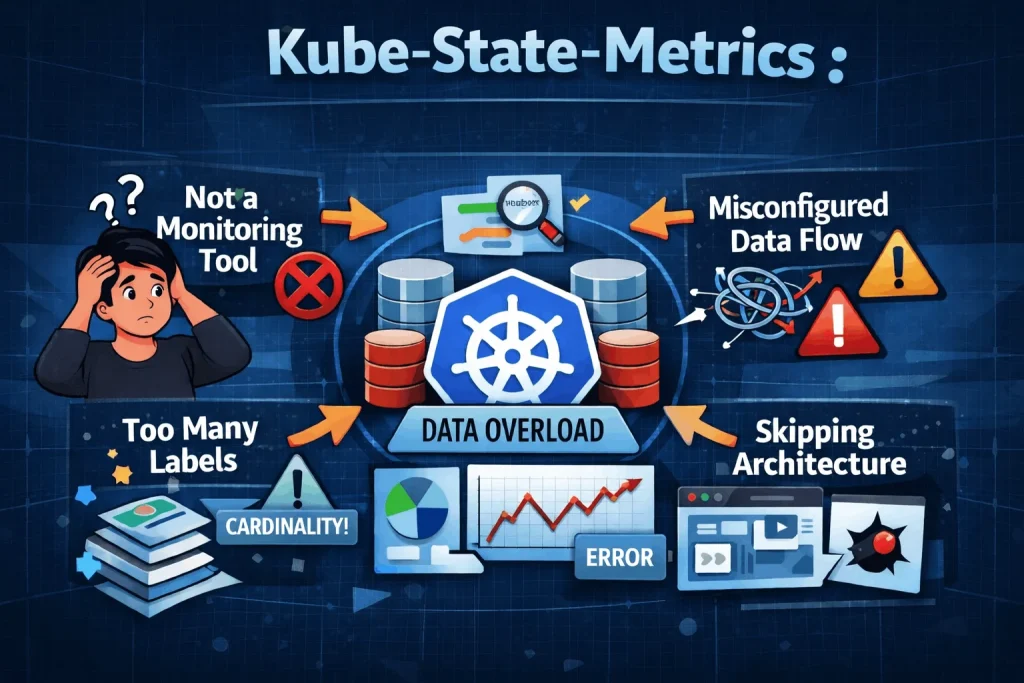
3. Overloading Labels
Adding too many labels can create problems. More labels mean more combinations of data. This increases cardinality. High cardinality:
- slows down queries
- makes dashboards harder to manage
Start with only important labels. Add more only when you really need them.
4. Skipping Architecture Understanding
Many users jump straight into dashboards. They copy queries without understanding the system. When something goes wrong:
- queries feel confusing
- results do not match expectations
A basic understanding of the architecture makes everything easier. You know where the data comes from and how to use it properly.
Conclusion
Kube state metrics architecture is not complicated, but it is often misunderstood. Once you see the flow clearly, everything clicks into place. And more importantly, your monitoring setup starts to make sense.
FAQ Section
1. What is kube state metrics architecture in simple terms?
It is the system that converts Kubernetes object data into Prometheus metrics and makes it available for monitoring tools.
2. How does kube-state-metrics get its data?
It reads data directly from the Kubernetes API server by watching resources like pods, deployments, and nodes.
3. Does kube-state-metrics store data?
No. It only exposes the current state via an endpoint. Prometheus is responsible for storing historical data.
4. Is kube-state-metrics required for Kubernetes monitoring?
It is not strictly required, but it is essential if you want visibility into cluster state, not just resource usage.
5. What is the difference between kube-state-metrics and metrics server?
Metrics server provides resource usage (CPU, memory), while kube-state-metrics provides object state (status, replicas, conditions).