
If you are using Kubernetes in production, raw metrics are not your problem but visibility is. You can already monitor CPU and memory. But that does not tell you why pods are restarting, why deployments fail, or why replicas do not match expectations.
That is where kube-state-metrics Datadog integration becomes useful. Instead of guessing cluster behavior, you get structured insights into Kubernetes objects directly inside Datadog, where alerts, dashboards, and workflows already exist.
This guide shows you how it works, how to set it up correctly, and more importantly, when you actually need it.
What Kube-State-Metrics Adds to Datadog
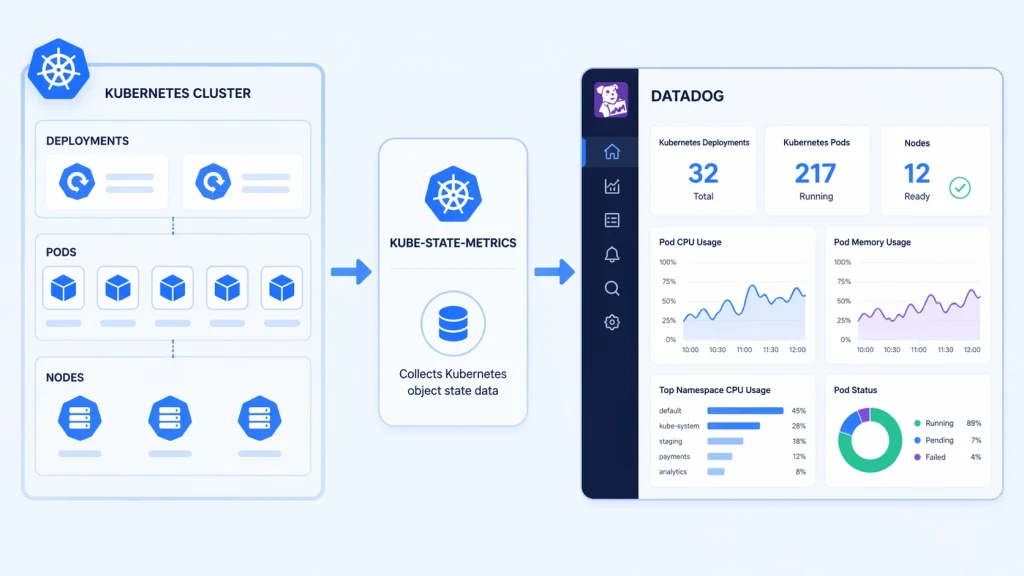
Datadog already collects infrastructure metrics. But Kubernetes is not just infrastructure, it is a system of objects. Kube-State-Metrics (KSM) exposes the state of Kubernetes resources, not performance data. That includes:
- Pod status (Running, Pending, Failed)
- Deployment replicas (desired vs actual)
- Node conditions (Ready, NotReady)
- Job completions and failures
Without KSM, Datadog sees resource usage. With KSM, Datadog understands cluster behavior. That difference matters.
How the Integration Works (Simple View)
At a glance, this setup just connects two tools. But what really matters is how the data flows from your cluster into something you can actually understand and act on.
Step 1: Kube-State-Metrics Collects Data
Kube-State-Metrics (KSM) talks directly to the Kubernetes API. It does not monitor CPU or memory like traditional tools. Instead, it focuses on object state.
Think of things like:
- Is your deployment ready or stuck?
- How many replicas are actually running vs expected?
- Are pods restarting again and again?
KSM takes all of this raw state information and converts it into clean, structured metrics. This is the missing visibility layer most clusters need.
Step 2: Datadog Cluster Agent Scrapes Metrics
The Datadog Cluster Agent acts like a collector. It regularly “scrapes” the metrics exposed by KSM.
Instead of querying Kubernetes directly for everything, Datadog relies on KSM to provide a simplified and consistent stream of cluster state data. This reduces complexity and keeps monitoring efficient.
Step 3: Metrics Are Sent to Datadog
Once collected, the data is pushed into Datadog. Here is where things become useful:
- Metrics are stored and organized
- Historical trends become visible
- You can correlate state data with logs and performance metrics
This turns raw Kubernetes signals into something you can actually analyze.
Step 4: You Build Visibility on Top
Now comes the part that impacts your day-to-day work. Inside Datadog, you use this data to:
- Create dashboards that show cluster health at a glance
- Set alerts when something breaks (like pods not becoming ready)
- Build monitors that catch issues before users notice
Instead of guessing what is wrong, you get clear signals tied to real cluster events.
Kube-State-Metrics Datadog Setup (Step-by-Step)
You do not need a complex setup, but you do need a correct one.
Step 1: Deploy Kube-State-Metrics
If you are using Helm:
“`bash
helm install kube-state-metrics prometheus-community/kube-state-metrics
“`
This deploys a service that exposes Kubernetes object metrics. Make sure:
- It is running in your cluster
- The service endpoint is reachable
Step 2: Enable Datadog Kubernetes Integration
If you are using the Datadog Agent, Kubernetes integration is typically enabled by default. But you need to ensure:
- Cluster Agent is installed
- RBAC permissions allow metric collection
- Autodiscovery is active
Step 3: Configure Kube-State-Metrics Collection
Datadog needs to scrape KSM explicitly. In most setups, this is done via Autodiscovery annotations or Helm values. Example:
“`yaml
datadog:
kubeStateMetricsEnabled: true
“`
Or ensure the Cluster Agent is configured to detect the KSM service.
Step 4: Verify Metrics in Datadog
Once everything is connected, check for metrics like:
- `kubernetes_state.pod.status_phase`
- `kubernetes_state.deployment.replicas_desired`
- `kubernetes_state.node.condition`
If these appear, your setup is working.
What You Can Actually Monitor (Real Use Cases)
This is where most setups fail: collecting data without purpose. Here is what this integration is actually good for.
1. Deployment Health Tracking
You can compare:
- Desired replicas
- Available replicas
If they do not match, something is wrong even if the CPU looks fine.
2. Pod Failure Detection
Instead of waiting for logs, you can detect:
- CrashLoopBackOff
- Pending pods
- Failed scheduling
This is faster and easier to alert on.
3. Node Readiness Issues
When nodes go NotReady, KSM exposes it instantly. This allows early alerts before workloads fully fail.
4. Job and CronJob Monitoring
Track:
- Successful completions
- Failed jobs
- Missed schedules
This is critical for pipelines and batch processing.
Datadog vs Prometheus: Where This Fits
This question comes up often: Why use Datadog instead of Prometheus for KSM?
Prometheus Approach
- Scrapes KSM directly
- Requires manual dashboards and alerting setup
- Full control, but more work
Datadog Approach
- Integrates KSM into existing monitoring
- Easier dashboards and alerting
- Less setup overhead
Neither is “better.” Use Prometheus if you want control. Use Datadog if you want speed and simplicity.
Kube-State-Metrics vs Datadog (Not a Real Comparison)
Many people try to compare these two, but they solve different problems.
Kube-State-Metrics is a data source. It reads Kubernetes objects and turns their state into metrics (like pod status, replica counts, deployment health).
Datadog is a monitoring platform. It takes those metrics and helps you:
- visualize them in dashboards
- track trends
- get alerts when something breaks
In simple terms, Datadog shows how your system performs. KSM explains what is actually happening inside Kubernetes.
When both work together, you move from basic monitoring to real observability. There, you do not just see problems, you understand them.
Common Mistakes to Avoid
1. Collecting Everything
More data sounds useful, but it creates noise. Too many metrics slow queries, increase cost, and make dashboards messy. Start with key metrics, then expand only if needed.
2. Ignoring Labels
Labels add context, but too many cause high cardinality, which can break queries and dashboards. Keep only labels you actually use.
3. Skipping RBAC Checks
Wrong permissions = missing data. And it often fails silently. Always verify ServiceAccount, Roles, and Bindings if metrics look incomplete.
4. Not Building Alerts
Without alerts, data just sits there. Set alerts for real issues like pod failures, replica mismatches, and unhealthy nodes so you can react quickly.
5. Treating It as “Set and Forget”
Your cluster changes over time, so your monitoring should too. Regularly clean up unused metrics, adjust alerts, and keep dashboards relevant.
When You Should Use This Setup
This integration makes sense if:
- You already use Datadog
- You need Kubernetes object visibility
- You want faster setup vs Prometheus
It may not be ideal if:
- You want full control over metrics pipeline
- You prefer open-source tooling only
- You already have a mature Prometheus setup
Practical Optimization Framework
If your setup feels noisy or hard to manage, this simple approach keeps things clean and useful from day one.
Step 1: Start With Core Objects
Begin with the basics inside Kube-State-Metrics. Focus on pods, deployments, and nodes. These three give you a clear picture of cluster health:
- pods show what is running (or failing)
- deployments show if your app is stable
- nodes show if the infrastructure is healthy
This keeps your data small but meaningful.
Step 2: Build Only Critical Alerts
In Datadog, avoid creating too many alerts at the start. Focus only on issues that need immediate attention:
- pods failing or restarting
- replicas not matching desired state
- nodes becoming unhealthy
This helps you avoid alert fatigue and keeps notifications important.
Step 3: Expand Based on Need
Do not try to predict every future issue. Add more metrics only when:
- you face a real problem
- you need deeper visibility to debug something
This way, every metric you add has a clear purpose.
Step 4: Keep It Lean
Over time, things pile up. Clean your setup regularly:
- remove metrics you never use
- simplify dashboards that feel cluttered
A lean setup makes Datadog faster, easier to read, and much more reliable.
Troubleshooting Tip
If your metrics are missing, do not overthink it. In most cases, the problem is something simple and easy to fix.
Start by checking the connection between Datadog and Kube-State-Metrics. If Datadog is not scraping KSM, no data will ever show up even if everything else looks fine.
Next, look at RBAC permissions. If roles or bindings are wrong, KSM cannot read Kubernetes objects properly. The tricky part is that it may still run, but return incomplete or empty metrics.
Then verify the service endpoint. Make sure:
- the KSM service is running
- the endpoint is reachable from the Datadog agent
- there are no network or DNS issues blocking access
These three checks solve most issues quickly. Fix them first before going deeper into logs or advanced debugging.
Conclusion
Kube-State-Metrics does not replace Datadog, it completes it. Without it, you see resource usage. With it, you understand what your cluster is actually doing.
Set it up cleanly. Start small. Build intentionally. That is how you turn metrics into something useful.
FAQ Section
1. What does kube state metrics Datadog integration do?
It allows Datadog to collect Kubernetes object state metrics such as pod status, deployment replicas, and node conditions.
2. Do I need kube-state-metrics if I already use Datadog?
Yes, if you want visibility into Kubernetes object states. Datadog alone does not provide this level of detail.
3. Is Datadog better than Prometheus for kube-state-metrics?
Not necessarily. Datadog is easier to use, while Prometheus offers more control. The choice depends on your setup.
4. Does kube-state-metrics increase monitoring cost?
It can, especially if you collect too many metrics or use high-cardinality labels. Proper filtering helps control this.
5. Can I run kube-state-metrics without Datadog?
Yes. It is commonly used with Prometheus, but it works with any system that can scrape metrics.